
Bitesize Acoustics: Understanding A Noise Survey Graph
A Simple Guide to Reading Noise Survey Results
If you've recently received a noise survey report or acoustic assessment, you may have come across a graph filled with coloured lines, sound level data and technical terms such as LAeq, LA90 and LAmax. While these graphs can initially look complex, they are one of the most important tools used by acoustic consultants to understand and assess the acoustic environment around a site.
Noise survey graphs are widely used within planning applications, noise impact assessments, BS 8233 assessments, BS 4142 plant noise assessments, environmental permitting and licensing studies. They help explain how sound changes throughout the day and night and provide a visual representation of the noise environment.
Whether you are assessing a proposed development near a road, reviewing industrial noise, or simply trying to understand a report you have received, this guide explains how to read a typical noise survey graph in simple terms.
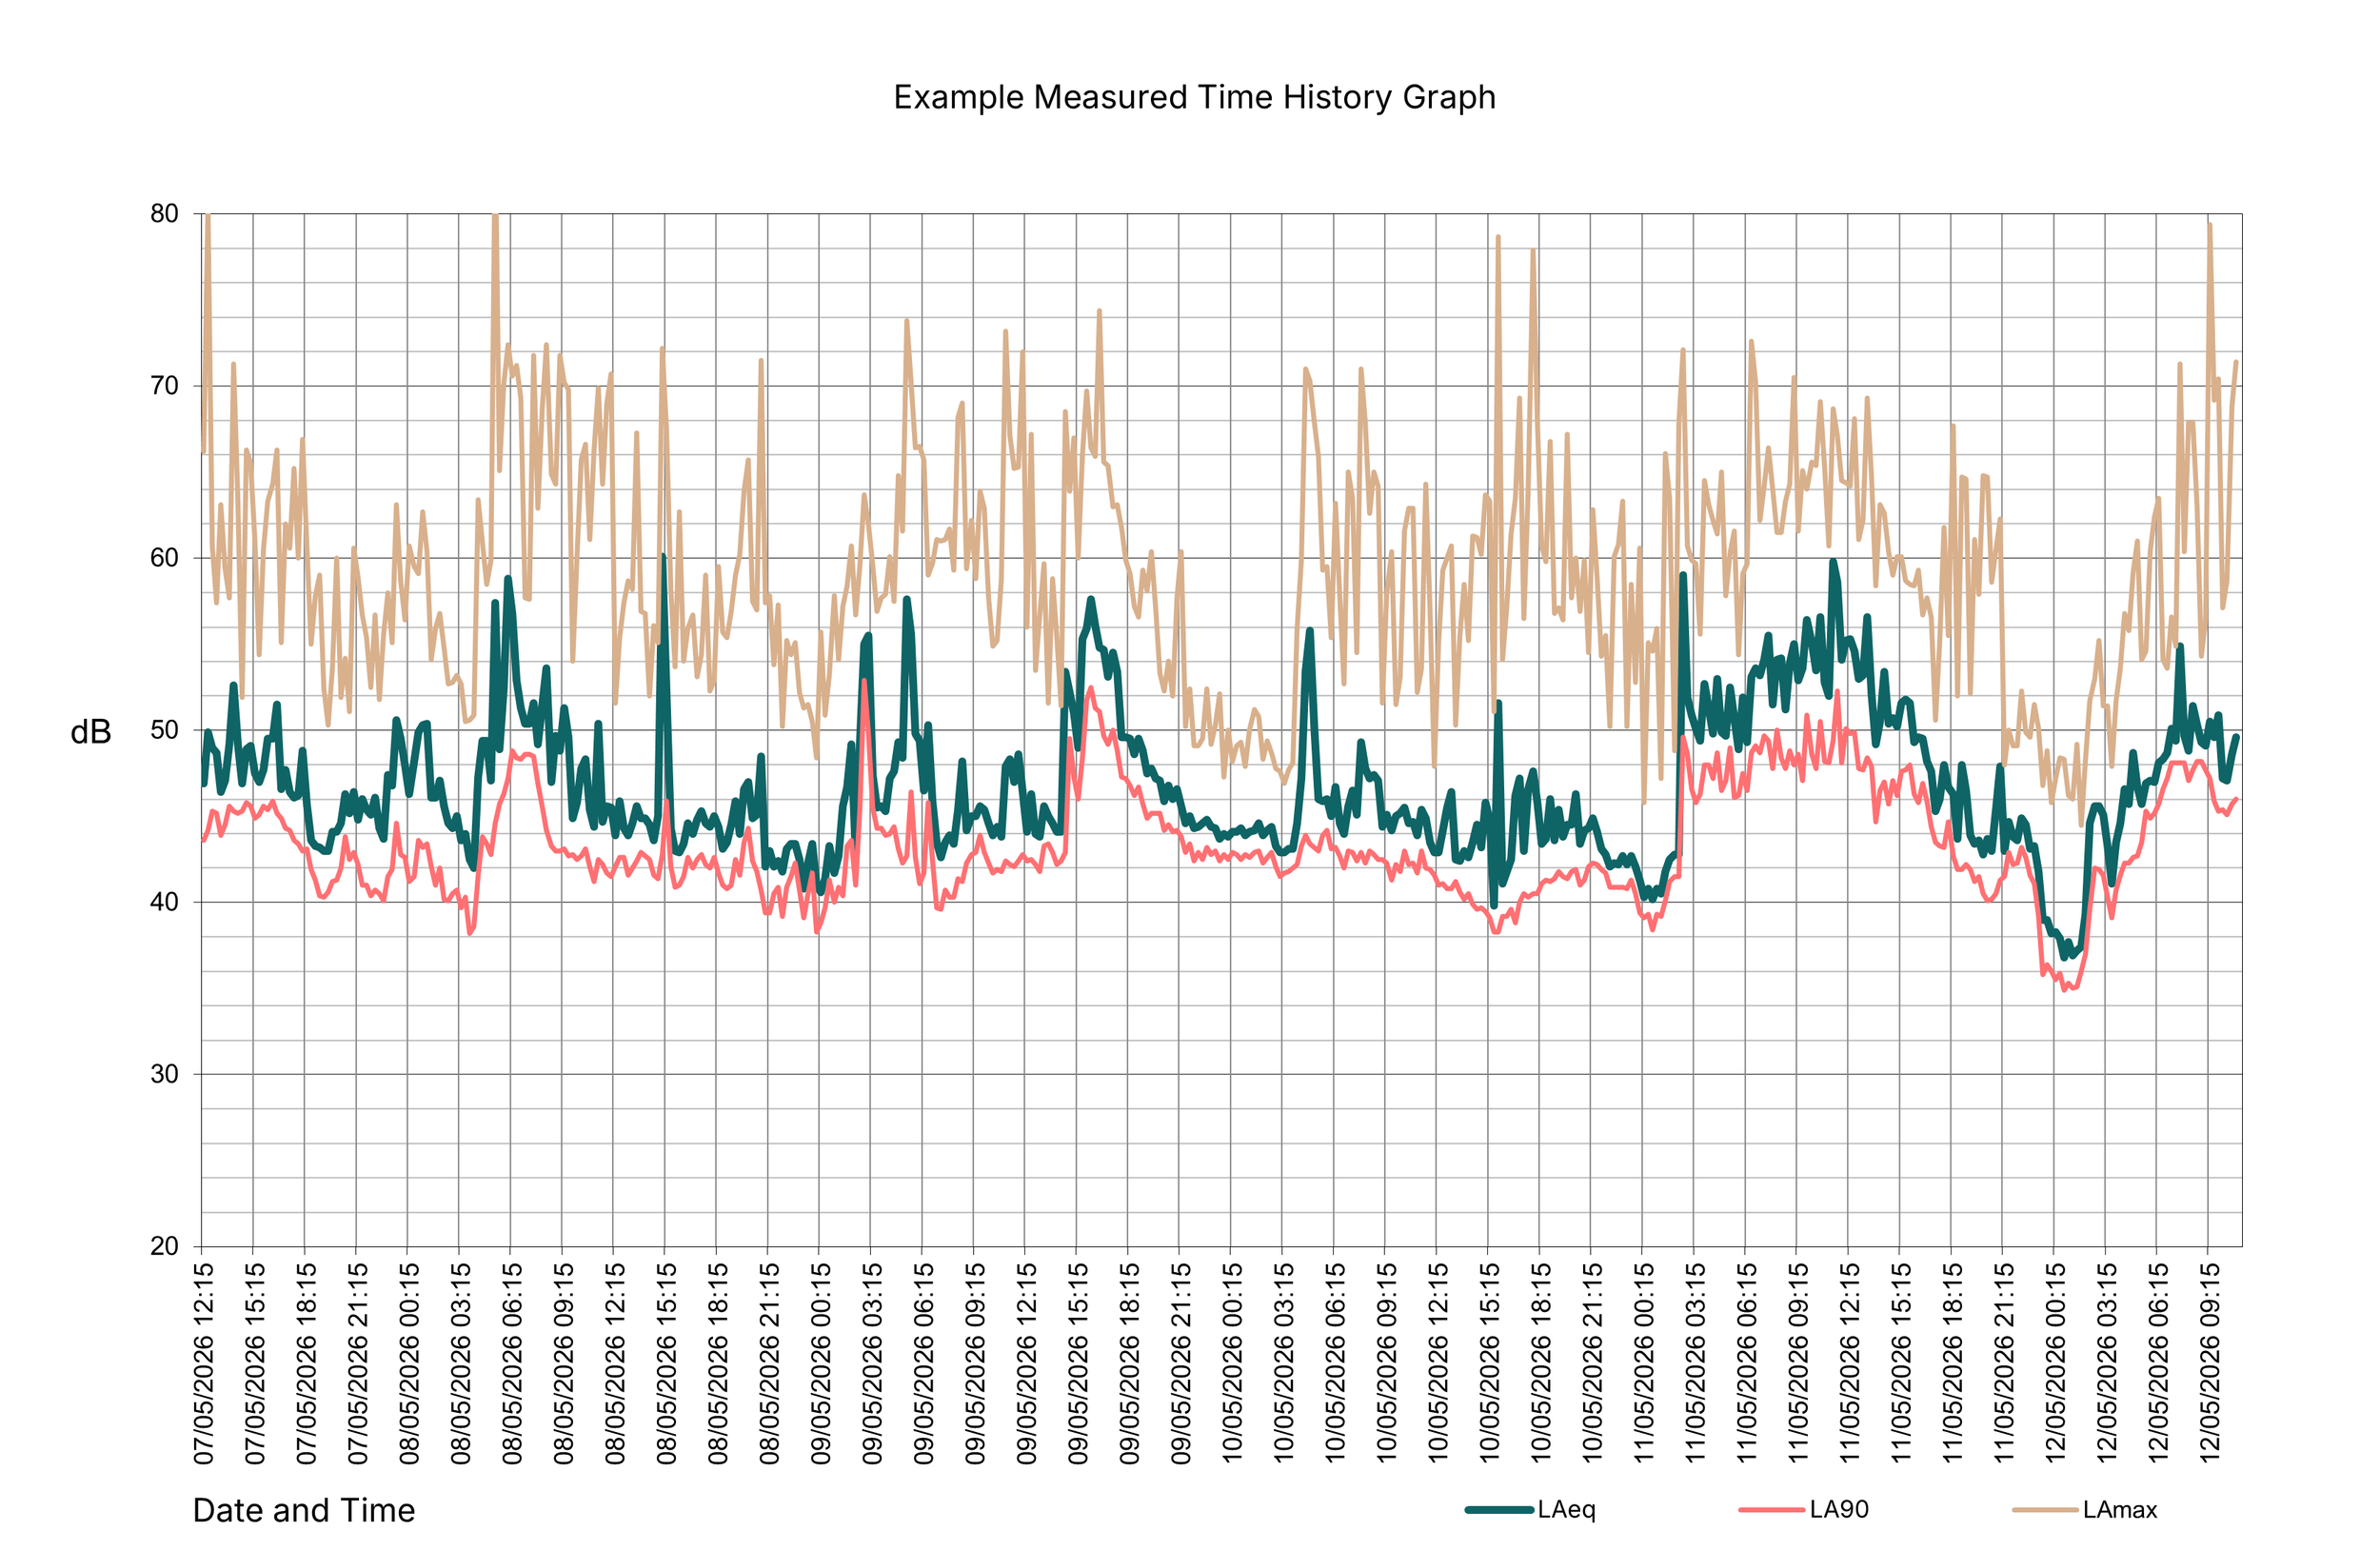
Example Noise Survey Graph
What Is a Noise Survey Graph?
A noise survey graph shows how sound levels change over time.
Rather than presenting hundreds or thousands of individual readings in tables, the graph allows trends and patterns to be quickly identified.
A typical graph contains:
Horizontal axis (X-axis):
Date and time
Vertical axis (Y-axis):
Sound level measured in decibels (dB)
The graph then displays various acoustic parameters measured during the survey period.
In the example above, three key descriptors are shown:
LAeq - Average sound level
LA90 - Background sound level
LAmax - Maximum sound level
Each parameter tells us something different about the surrounding acoustic environment.
Understanding LAeq: The Average Noise Level
The dark green line on the graph represents LAeq.
LAeq is the average sound level measured over a defined period of time and is one of the most commonly used measurements within a noise survey. It provides an overall indication of the acoustic environment during the monitoring period and helps describe the general noise climate at a location.
LAeq is widely used within:
Environmental noise surveys
Planning noise assessments
Traffic noise studies
BS 8233 assessments
Construction noise assessments
Noise impact assessments
For example, if sound levels fluctuate throughout the day due to changing activity levels, the LAeq provides a single representative value that reflects the average conditions over that period.
On many noise survey graphs, the LAeq typically follows broader activity patterns, often increasing during busier daytime periods and reducing overnight when surrounding activity levels decrease.
Because it represents the overall sound environment, LAeq is often used as the primary measurement for understanding existing baseline conditions and assessing potential impacts associated with a proposed development.
Understanding LA90: The Background Sound Level
The red line represents LA90.
LA90 is commonly known as the background sound level and measures the sound level exceeded for 90% of the monitoring period.
In simple terms, it represents the underlying sound environment after excluding many short-term events.
Think of it as the "typical" or steady noise climate.
Examples may include:
Distant traffic
Wind through vegetation
Continuous building services
Low-level urban activity
LA90 is particularly important for:
BS 4142 assessments
Industrial noise assessments
Air source heat pump assessments
Fixed plant noise studies
Acoustic consultants frequently use background sound levels to assess whether new sound sources could cause disturbance.
Understanding LAmax: The Loudest Sound Events
The beige line on the graph represents LAmax.
LAmax records the highest sound level measured during each survey period.
Unlike LAeq and LA90, it does not represent an average. Instead, it captures short-duration peak noise events.
Examples may include:
Vehicle pass-bys
Aircraft flyovers
Train movements
Door slams
Waste collections
Sudden industrial activity
LAmax is commonly used when assessing:
Sleep disturbance
Night-time noise impacts
Railway noise
Intermittent sound sources
You'll notice that LAmax often produces sudden spikes well above the other lines. These spikes usually indicate isolated sound events rather than continuous activity.
Why Do Noise Levels Change Throughout the Day?
Sound environments are constantly changing.
Noise levels naturally rise and fall due to:
Traffic flows
Human activity
Commercial operations
Deliveries
Weather conditions
Aircraft movement
Time of day patterns
On many graphs, all sound level parameters rise together during busy daytime periods and reduce overnight.
Individual spikes often indicate temporary events rather than long-term background conditions.
Understanding these trends helps determine whether the measured environment is representative.
Why Weather Conditions Matter During Noise Surveys
Weather conditions can influence measured sound data and may increase noise levels beyond those typically experienced during dry and calm conditions. This is particularly important for assessments such as BS 4142, where the aim is to establish representative baseline sound levels for assessing the impact of a proposed noise source. If adverse weather conditions artificially elevate the measured sound environment, the baseline levels may not accurately reflect typical conditions, potentially resulting in the perceived impact of a new noise source being underestimated.
It is important to measure the following weather conditions during a survey:
Rainfall
Windspeed
Wind Direction
Professional surveys often include weather monitoring alongside sound measurements to ensure reliable and representative data.
How Noise Survey Graphs Are Used
Noise survey graphs are used to help acoustic consultants:
Establish baseline sound levels
Assess environmental impacts
Support planning applications
Compare existing and proposed sound sources
Demonstrate compliance with guidance
They provide an easy way to understand complex datasets and communicate acoustic information clearly.
Final Thoughts
Noise survey graphs can initially appear technical, but once broken down into their individual components they become much easier to understand.
The key is remembering:
LAeq = average sound level
LA90 = background sound level
LAmax = loudest events
Together, these measurements tell the story of how a sound environment behaves over time and form the basis of many professional acoustic assessments.
Understanding what each line represents can make it much easier to interpret a noise survey report and understand the conclusions reached by an acoustic consultant.